Overview
Once the SonarQube platform has been installed, you're ready to install a scanner. You must install and configure the scanner that is most appropriate for your needs depending on your build tool. Then, you will start the analysis of your project by invoking the scanner in your CI pipeline after you build and before you do any sort of archiving or deployment. The scanner installation and invoking are explained in detail in the documentation of the corresponding scanner:
- Gradle - SonarScanner for Gradle
- .NET - SonarScanner for .NET
- Maven - SonarScanner for Maven
- Jenkins - SonarQube extension for Jenkins
- Azure DevOps - SonarQube Extension for Azure DevOps
- Ant - SonarScanner for Ant
- Anything else - SonarScanner CLI
You may use one of the following options:
- You install the scanner on your CI/CD host and, when you start your first analysis, the corresponding project is automatically created in SonarQube.
- You create first a project in the SonarQube UI. During the creation, you will be asked about the CI tool you are using and you will be guided through a tutorial to install the appropriate scanner on your CI/CD host.
To create a project, you use the Create Project button on the Projects page, which is visible to users with project creation rights.
SonarQube integrations are supported for popular DevOps Platforms: GitHub Enterprise and GitHub.com, BitBucket Server, Azure Devops Server and Azure DevOps Services.
What does analysis produce?
SonarQube can analyze up to 29 different languages depending on your edition. The outcome of this analysis will be quality measures and issues (instances where coding rules were broken). However, what gets analyzed will vary depending on the language:
- On all languages, "blame" data will automatically be imported from supported SCM providers. Git and SVN are supported automatically. Other providers require additional plugins.
- On all languages, a static analysis of source code is performed (Java files, COBOL programs, etc.)
- For certain languages, the static analysis should be done on compiled code ( .class files in Java, .dll files in C#, etc.)
Will all files be analyzed?
By default, only files that are recognized by your edition of SonarQube are loaded into the project during analysis. For example, if you're using SonarQube Community Edition, which includes analysis of Java and JavaScript, but not C++, all .java and .js files would be loaded, but .cpp files would be ignored.
What about branches and pull requests?
Developer Edition adds the ability to analyze your project's branches and pull requests as well as the ability to automatically report your pull request analysis to your DevOps platform interface.
What happens during analysis?
During analysis, data is requested from the server, the files provided to the analysis are analyzed, and the resulting data is sent back to the server at the end in the form of a report, which is then analyzed asynchronously server-side.
Analysis reports are queued and processed sequentially, so it is quite possible that for a brief period after your analysis log shows completion, the updated values are not visible in your SonarQube project. However, you will be able to tell what's going on because an icon will be added on the project homepage to the right of the project name. Mouse over it for more detail (and links if you're logged in with the proper permissions).

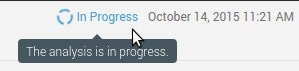
The icon goes away once processing is complete, but if analysis report processing fails for some reason, the icon changes:

© 2008-2024 SonarSource SA. All rights reserved. SONAR, SONARSOURCE, SONARLINT, SONARQUBE, SONARCLOUD, and CLEAN AS YOU CODE are trademarks of SonarSource SA.